In the Taiwan stock market, credit trading (margin buying and short selling) serves as a critical mechanism for observing market leverage and investor sentiment. Unlike institutional investors with ample capital, retail investors often face capital constraints and therefore resort to margin buying to increase their purchasing power. Consequently, margin data serves as a key barometer for retail trading heat.
Key indicators for monitoring credit trading include daily margin/short volume, balance, margin utilization rates, and—most crucially—the Margin Maintenance Ratio (MMR).
The MMR is a core metric used to assess the risk status of margin accounts and determine how close investors are to a margin call. Brokers set specific MMR thresholds to mitigate default risks during periods of high market volatility.
Taiwan’s Credit Trading Mechanism and MMR Definition
In Taiwan, credit trading allows investors to leverage their positions by borrowing funds or securities from brokers based on personal credit or collateral.
Margin Buying: Borrowing funds to purchase stocks. The margin financing ratio is typically 60% for listed companies and 50% for OTC companies.
Short Selling: Borrowing shares to sell in the market, aiming to buy them back at a lower price. The current margin requirement for short selling is 90%.
Account Eligibility: To ensure data reflects experienced participants, investors must meet specific criteria: the account must be open for at least 3 months, with 10+ trades in the past year, and meet specific turnover and financial proof requirements.
Defining the Margin Maintenance Ratio (MMR)
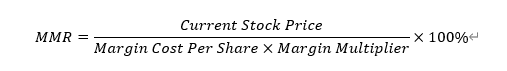
The MMR is defined as:
Margin Multiplier:60% for Listed companies; 50% for OTC companies.
In the Taiwan market, several quantitative thresholds are critical:
166%: The initial maintenance ratio for listed companies (calculated at 60% margin).
130%–160% (Safe Buffer Zone): While paper losses exist, there is no immediate pressure to add capital; this is considered the psychological defense line for margin holders.
130% (Margin Call Threshold): If the MMR falls below 130%, brokers issue a margin call. Investors must provide collateral within T+2 business days, or the broker may execute a forced liquidation on the third day.
80%–90% (Systemic Sell-off Zone): Since retail investors often enter at market peaks and fail to stop losses, the MMR can plummet to 80%–90% during rapid downturns, triggering massive systemic selling pressure due to collective liquidations.
⭐Case Study: The April 2025 Market Margin Meltdown⭐
To understand the link between MMR and market risk, we look back at the extreme volatility in early April 2025. TheTaiwan Stock Exchange Index( TAIEX) plunged 2,065 points (-9.6%) in a single day, the third-largest drop in history.
Systemic Liquidation Pressure: Average market MMR dropped to 133.8%, with 589 stocks falling below the 130% threshold. This triggered market-wide margin calls and a downward spiral of forced liquidations.
Data on Popular Stocks:
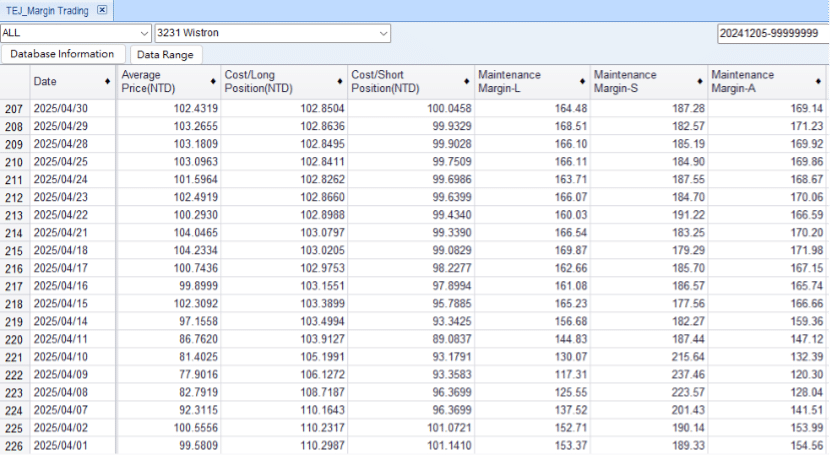
Wistron (3231): According to TEJ data, its MMR hit 117.31%, placing most margin accounts well below the legal threshold and into liquidation.
Gigabyte (2376): TEJ data showed MMR touching 113.40%, leading to several days of intense forced selling pressure.
MMR Strategy Backtesting
1. Strategy Concept and Logic
Beyond its role as a lagging risk indicator, MMR can serve as a leading signal for market sentiment shifts. This study tests whether stocks exhibit mean-reversion behavior when the MMR falls significantly below its moving average.
Entry Conditions & Filters:
MMR Anomaly Identification: Daily MMR < 10-day moving average (MMR_10), identifying an extreme margin pressure zone.
Volume Exhaustion Filter: Daily volume < 10-day average volume, suggesting retail selling pressure has subsided.
Price Stabilization: Daily close > open (a bullish candlestick) to capture technical reversal timing.
Structural Resilience: Margin balance must stay above 95% of its 5-day average, indicating holders have not completely surrendered.
Execution & Risk Control:
Mechanism: Enter at the opening price on the day the signal appears.
Exit: Hold for 15 trading days, or exit at +40% Take-Profit or -10% Stop-Loss.
Signal Extension: If a new signal appears during the holding period, the 15-day window resets to capture continued momentum.
Backtest Period: From 2020 to 2025, utilizing a Daily Rolling Check to identify entry signals.
Evaluation Metrics: A multi-dimensional assessment focusing on Annualized Return, Sharpe Ratio, Maximum Drawdown (MDD), and Calmar Ratio,etc.
Figure1:Margin Maintenance Ratio (MMR)
Performance Comparison and Multi-Dimensional Metric Analysis
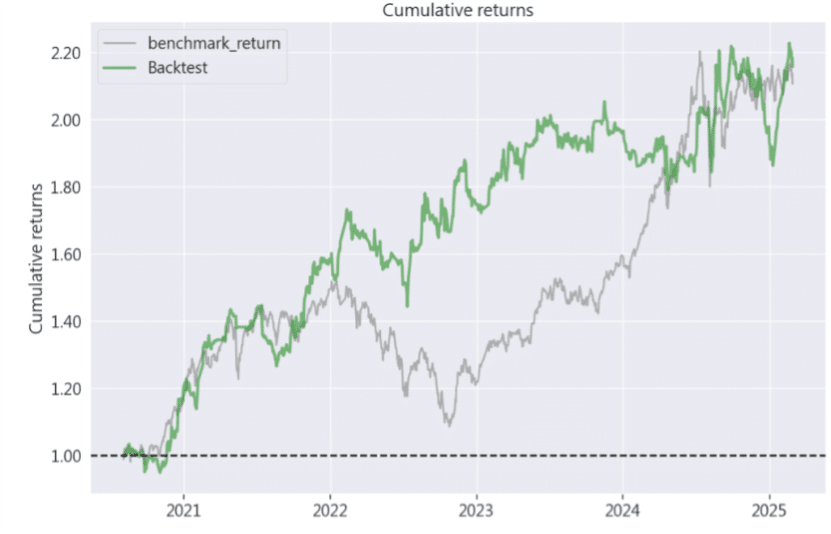
Figure 2: Cumulative Returns
Table 1: Performance Metrics
Performance Metric
Benchmark
MMR Investment Strategy
Annualized Return
18.39%
19.04%
Cumulative Return
110.51%
115.6%
Annualized Volatility
17.67%
16.897%
Sharpe Ratio
1.04
1.12
Calmar Ratio
0.65
1.14
Max Drawdown
-28.47%
-16.68%
According to Table 1, the Margin Maintenance Ratio (MMR) strategy demonstrates superior stability compared to the market benchmark across all core performance metrics:
Superior Risk-Adjusted Returns: The Sharpe Ratio (1.12) outperformed the benchmark (1.04), providing higher excess returns per unit of risk.
Resilience Against Drawdowns: The strategy’s strongest suit is its Calmar Ratio (1.14 vs. 0.65), reflecting robust defense during extreme volatility like April 2025.
Downside Protection: Max drawdown was limited to -16.68% (compared to -28.47% for the market), effectively preserving capital while reducing investor psychological stress.
Long-Term Capital Appreciation: The MMR strategy (115.6%) consistently outperformed the benchmark (110.51%). This demonstrates its statistical significance and practical profitability in real-world trading.
Conclusion
This strategy uses the Margin Maintenance Ratio (MMR) as a core indicator to capture mean-reversion opportunities following extreme market pessimism and the exhaustion of leveraged liquidations. Empirical results demonstrate that the strategy consistently outperforms the market benchmark in both annualized and cumulative returns, proving its potential for long-term alpha generation in dynamic environments. Despite moderate volatility, the strategy’s risk-adjusted performance—evidenced by significantly higher Sharpe and Calmar Ratios—confirms robust profit stability. Exceptional drawdown control (-16.68% Max Drawdown) further validates the MMR factor’s ability to resist market turbulence and protect portfolio value during systemic crashes, such as the April 2025 market meltdown. Overall, the strategy successfully quantifies market sentiment to capture excess returns during technical rebounds, making it ideal for investors seeking steady growth through reliable risk management and a proven ability to consistently beat the benchmark.
📘 Disclaimer: The analysis provided in this article is for informational purposes only and does not constitute investment advice or recommendations for any specific financial product.