
Table of Contents
Burton G. Malkiel has been one of the most influential economists since the 1970s. In his 1973 classic, A Random Walk Down Wall Street, he proposed the famous “Random Walk Theory,” arguing that markets are efficient most of the time and strongly advising the public to prioritize low-cost index investing.
However, Malkiel also recognizes that markets are not flawless. For investors seeking to outperform the market, he offers a “survival guide.” He contends that investors should not blindly follow technical analysis but should instead rationally combine the “Firm-Foundation Theory” (intrinsic value based on fundamentals) with the “Castle-in-the-Air Theory” (psychology of crowd expectations) to identify targets with growth potential and reasonable valuations.
The core of his strategy is not predicting short-term market trends, but rather using disciplined and verifiable criteria to screen for companies whose “earnings have growth potential, yet whose valuations have not been fully reflected by the market,” thereby countering random market volatility through long-term investing.
This research utilizes the TEJ Quantitative Database and the TQuant Lab backtesting system to precisely adapt this master’s framework—originating from the 20th-century U.S. stock market—to the modern Taiwan stock market. Through high-quality data backtesting, we will verify whether this “rational stock picking” strategy can still generate alpha in Taiwan and demonstrate the practical value of data-driven decision-making in risk management and return enhancement.
To translate Malkiel’s philosophy of “High Quality, Low Valuation” into actionable quantitative logic, we have defined the following entry and exit criteria:
All data for this study is sourced from the TEJ (Taiwan Economic New Research) database, with standardization applied to ensure consistency across multiple years.
Empirical evidence from the TQuant Lab backtesting system demonstrates that Burton G. Malkiel’s “Growth and Valuation Balanced Strategy” exhibits exceptional stability. The backtesting results indicate that over the 64-month testing period, the strategy not only significantly outperformed the broader market in terms of cumulative returns but also demonstrated superior alpha-generating capabilities (with an Alpha of 0.22).
Despite the high volatility of the Taiwan stock market—with an annualized volatility of approximately 32.97%—the strategy maintained a high level of profit efficiency by rigorously screening for targets with actual earnings growth and low P/E ratios. Its Sharpe Ratio reached 1.10, indicating that the strategy provides excellent risk-adjusted returns while accounting for market risks.
Table: Summary of Strategy Performance Metrics
| Metric | Malkiel’s Selection Strategy | Benchmark |
| Annual return | 36.24% | 15.97 % |
| Cumulative returns | 421.60% | 120.63% |
| Annual Volatility | 32.97% | 18.53 % |
| Sharpe Ratio | 1.10 | 0.893 |
| Max Drawdown | -38.22 % | -26.74% |
| Alpha | 0.22 | -0.003 |
| Beta | 0.92 | 0.93 |
As observed from the cumulative return curve, the strategy demonstrated exceptional upside potential during the Taiwan stock market’s bull run post-2020. This is primarily attributed to the stock selection filters, which accurately captured enterprises with dual excellence in revenue growth and net profit after tax (NPAT).
Even during the significant market correction in 2022, the performance gap between the strategy and the broader market continued to widen, generating significant alpha. This resilience was largely due to the valuation cushion provided by the low P/E ratio requirement, which offered protection during the downturn.
Figure 1: Strategy Cumulative Returns Chart
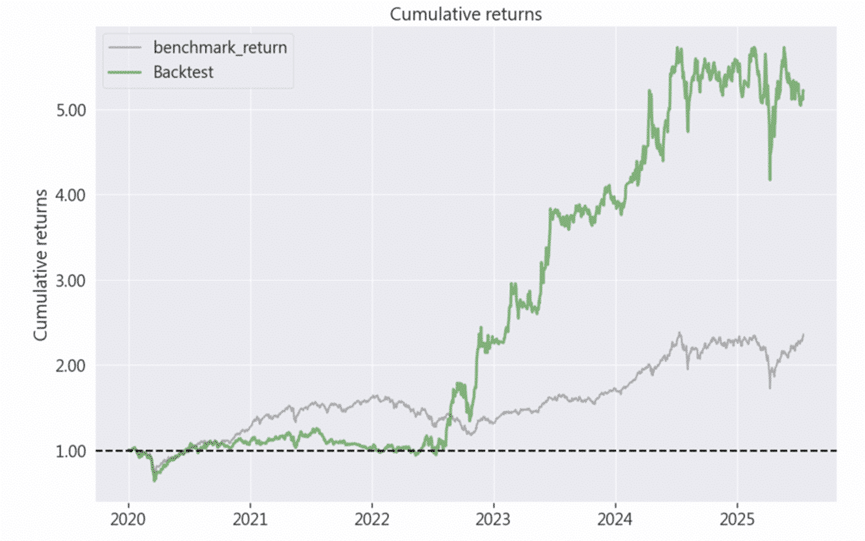
Note: The green line represents the Backtested Strategy, while the grey line represents the Benchmark (TAIEX).
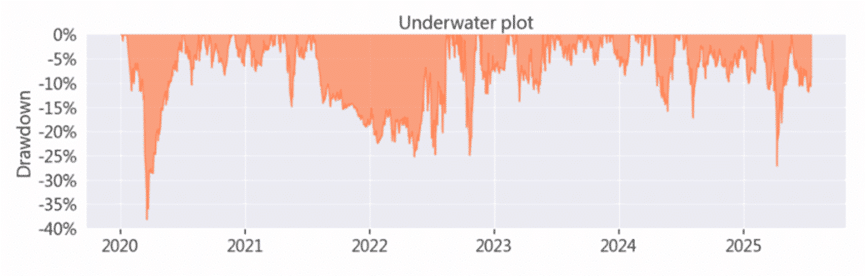
Figure 2: Maximum Drawdown Profile
Maximum Drawdown (MDD) reflects the most extreme paper losses an investor might encounter during the investment process. This strategy recorded an MDD of -38.219%, indicating that even with a stable selection logic, significant volatility can still occur during periods of systemic risk.
This serves as a reminder to quantitative investors that while pursuing high returns, they must simultaneously consider position concentration and risk exposure management. Through data analysis, investors can understand how to utilize risk factors within the TEJ database to further optimize entry and exit timing, thereby alleviating the psychological pressure caused by significant drawdowns.
Empirical evidence derived from the TEJ API and TQuant Lab demonstrates that Burton G. Malkiel’s stock-picking rules exhibit significant effectiveness within the Taiwan stock market. The core logic of this study involves a dual screening process combining “earnings growth momentum” with “relative valuation levels.” The empirical results show that over a 64-month testing period, the portfolio achieved a cumulative return of 421.60% and an Alpha of 0.22, reflecting the quantitative model’s robust capacity to generate consistent excess returns.
In the highly volatile environment of the Taiwan market, the dual-filter approach—incorporating “P/E ratio ranking” and “revenue growth outperforming industry averages”—successfully identifies targets with long-term competitive advantages. These quantitative findings suggest that even in a market characterized by “random walk” traits, investors can construct statistically significant portfolios through rigorous factor definitions and high-quality database support. Furthermore, this strategy effectively mitigates the risk of valuation deviations driven by irrational market sentiment.
Despite the outstanding backtesting performance, an analysis of the risk metrics generated by TQuant Lab suggests the following areas for potential optimization: